Portfolio
as of March 31, 2025, and based on fair value unless otherwise noted
224
Portfolio companies
19.8%
Top 10 concentration3
$14.1bn
Portfolio Fair Value
10.8%
Weighted average annual yield on accruing debt investments4
63.3%
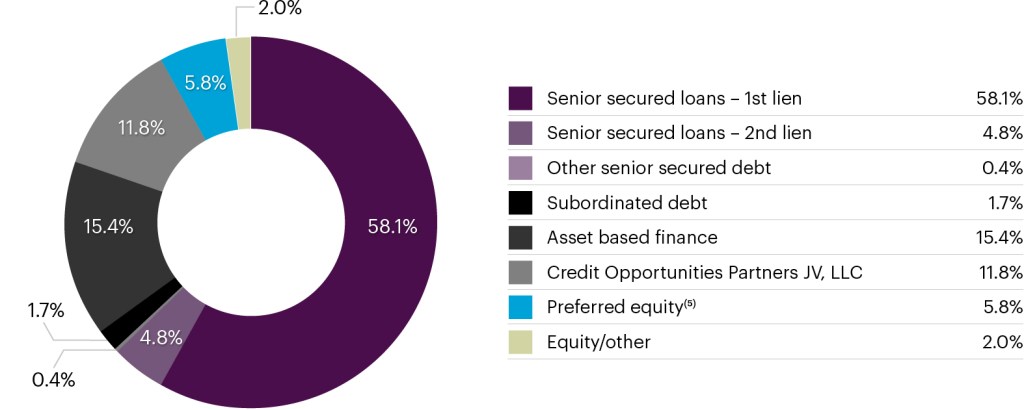
Senior secured investments1
$120mm / 5.7x
Median portfolio company EBITDA & leverage2
2.1%
Non-accrual rate at FV
23
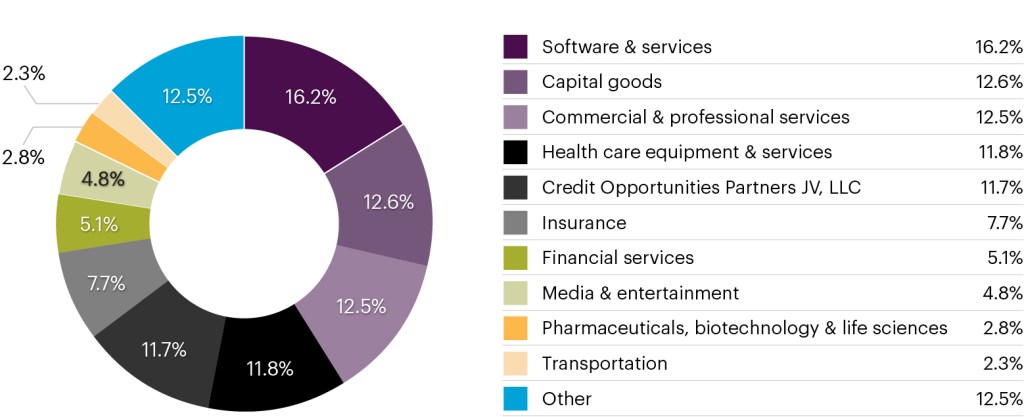
Industries
Security exposure
Sector exposure across top 10 industries
View important footnotes + disclosures
Note: Does not look through to FSK’s portfolio companies held solely in COPJV unless otherwise stated.
- Looking through to the investments in COPJV, senior secured investments total 72.6% as of March 31, 2025.
- Based on underlying Direct Origination corporate investments using most recently reported financial information and may include pro forma adjustments. Certain Asset Based Finance, Equity/Other and portfolio companies with negative or de minimis EBITDA are excluded.
- Figure excludes the impact of FSK’s investment in COPJV.
- Excludes the impact of the Merger. See FSK’s Quarterly Report on Form 10-Q for additional information on the calculation of weighted average annual yield on accruing debt investments. On a GAAP basis, FSK’s weighted average annual yield on accruing debt investments was 11.0% as of March 31, 2025.
- Included within Equity/Other in FSK’s Quarterly and Annual Reports on Form 10-Q and 10-K, respectively.